TTI Report: Nationwide Gridlock Costs $166 Billion Per Year
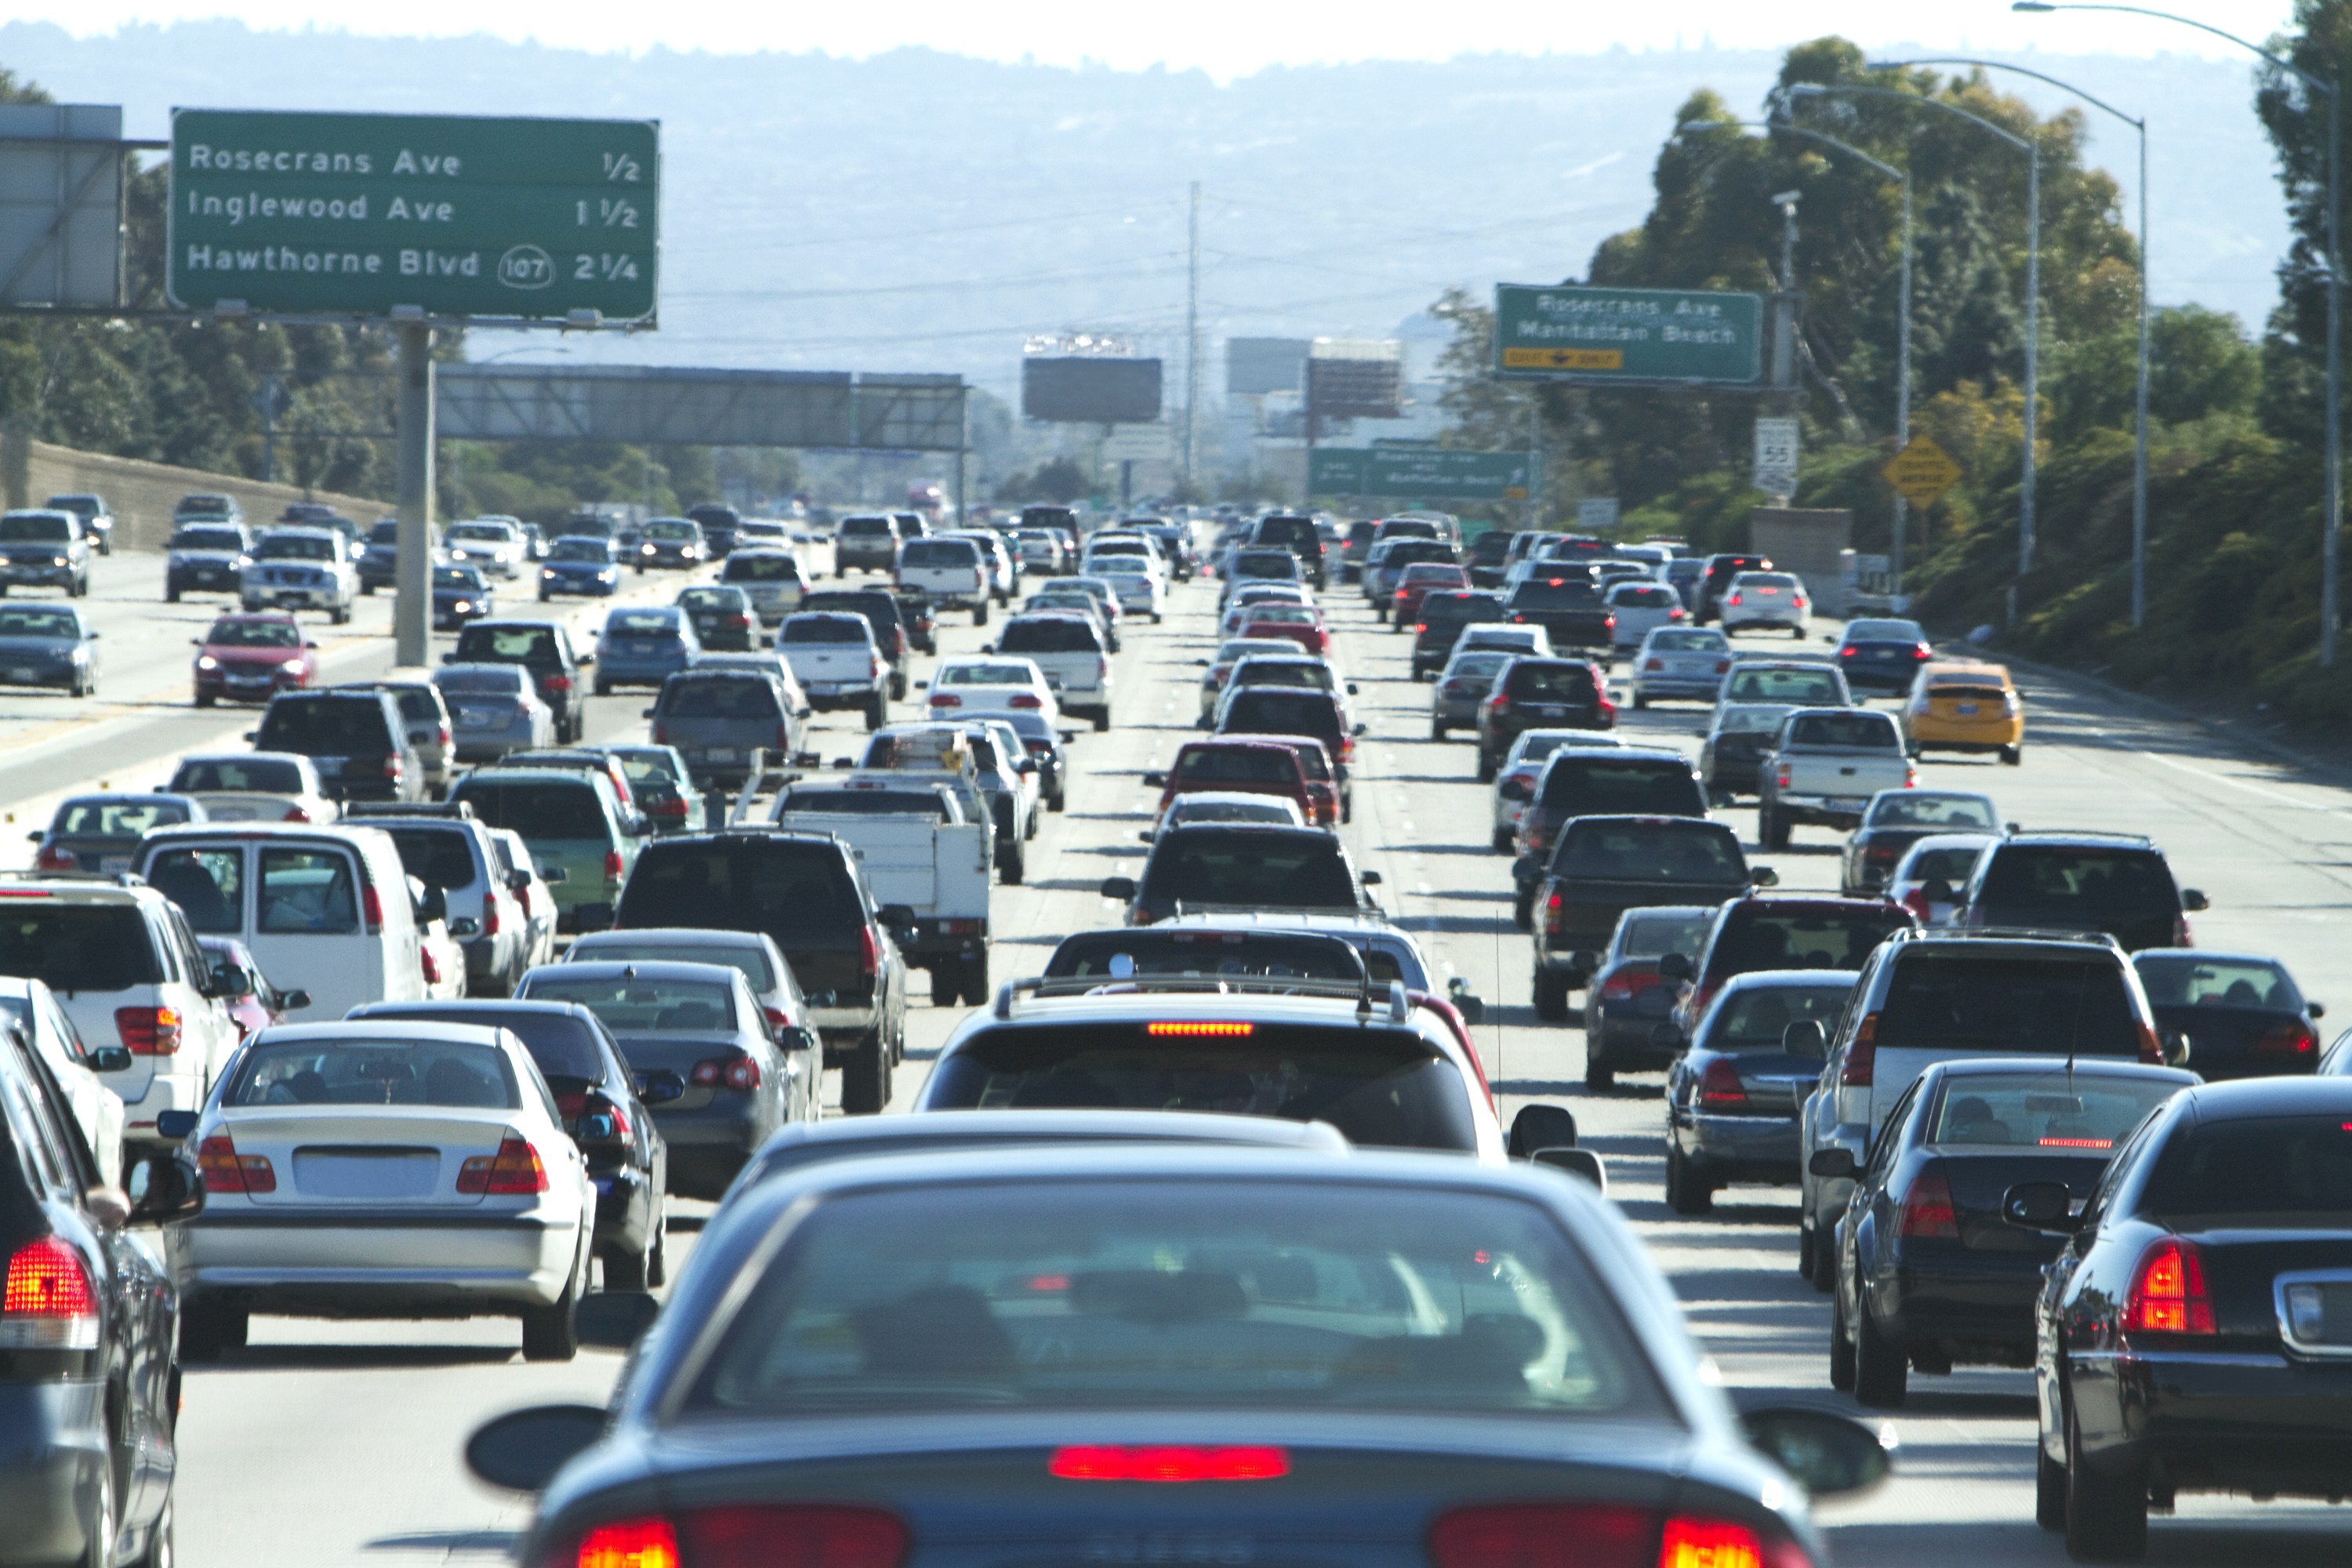
If more Americans are working, a new report confirms, more of us are also tied up in traffic.
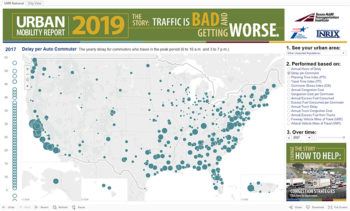
The picture is painted clearly in the 2019 Urban Mobility Report, published by the Texas A&M Transportation Institute (TTI). Along with illustrating the problem, researchers also stress the same straightforward solutions they’ve long advocated: more of everything — roads, transit, squeezing as much efficiency out of the existing system as possible, reducing demand through telework, better balancing demand and roadway capacity by adjusting work hours, and smarter land use.
“No single approach will ever solve this complex problem,” says Tim Lomax, a report author and Regents Fellow at TTI. “We know what works. What the country needs is a robust, information-powered conversation at the local, state and national levels about what steps should be taken. We have many strategies; we have to figure out the right solution for each problem and a way to pay for them.”
The United States added 1.9 million jobs from 2016 to 2017 — slower growth than the 2.3 million-plus growth in four of the five previous years, but more than enough to exacerbate the nation’s traffic woes.
TTI’s gridlock data extends back to 1982, when Ronald Reagan was in his first term, a postage stamp cost 20 cents, and gas was about $1.25 a gallon. Since that time, the number of jobs in the nation has grown almost nonstop by just over 50 percent to the current total of 153 million. Furthermore,
- the number of hours per commuter lost to traffic delay has nearly tripled, climbing to 54 hours a year;
- the annual cost of that delay per commuter has nearly doubled, to $1,010;
- the nationwide cost of gridlock has grown more than tenfold, to $166 billion a year; and
- the amount of fuel wasted in stalled traffic has more than tripled, to 3.3 billion gallons a year.
TTI has made available a nationwide interactive map of congestion conditions and a dozens of ways to address roadway gridlock in its How to Fix Congestion guide.
“The value of investing in our nation’s transportation infrastructure in a strategic and effective manner cannot be overstated as these added costs impact our national productivity, quality of life, economic efficiency and global competitiveness,” said Marc Williams, deputy executive director of the Texas Department of Transportation, which funded the TTI research. The 2008–2009 recession produced only a brief pause in traffic congestion growth, which bounced back at an even quicker pace than associated job recovery.”
The result is that the average freeway traveler has to allow almost twice the expected trip duration to ensure dependable arrival for time-sensitive things like medical appointments, day-care pickup, and airline flights. Instead of the 20 minutes needed in light traffic, it’s best to plan a 34-minute trip.

“Those minutes don’t sound like much, but they add up quickly over a year,” says David Schrank, a TTI senior research scientist and report author. “Eventually, we’re talking billions of wasted hours, and the cost of delay at that scale is just enormous.” Simply put, travel demand is growing faster than the system’s ability to absorb that demand. Once considered a problem exclusive to big cities, roadway gridlock now afflicts urban areas of all sizes and consumes far more of each day, making “rush hour” a long-outdated reference.”
“The problem affects not only commuters, but also manufacturers and shippers whose travel delay costs are passed on to consumers,” says Bill Eisele, a report author and TTI senior research engineer. “While trucks constitute only 7 percent of road traffic, they account for 12 percent of congestion cost.”
Researchers emphasize that it’s urgent for the nation to develop consensus on specific strategies for each urban travel corridor now, since major projects, programs and funding strategies take a decade or more to develop and bear fruit.
Almost every strategy works somewhere and in some situation, they say, and almost every strategy is the wrong idea in certain places at certain times. Using a balanced and diversified approach that focuses on more of everything — tempered by realistic expectations — is the best way forward.
The 2019 Urban Mobility Report examines conditions in 494 urban areas across all states and Puerto Rico. The research was supported by INRIX, a leading provider of transportation data and analytics.
Media contacts:
- Michelle Canton, 979-317-2404, m-canton@tti.tamu.edu
- Rick Davenport, 979-317-2408 r-davenport@tti.tamu.edu
This article originally appeared on the Texas A&M Transportation Institute website.