Hurricane Harvey was billed as a once-in-every-500-year event, and it more than lived up to its billing. It produced rainfall amounts that will re-write the weather books in Texas and the United States, says a Texas A&M University expert.
John Nielsen-Gammon, who is a Regents Professor of Atmospheric Sciences at Texas A&M and also serves as Texas State Climatologist, says Harvey set new standards for historic rainfall and flooding.
“Harvey is head and shoulders above all previous multi-day storms ever recorded in the continental United States,” says Nielsen-Gammon.
“I examined 18 different combinations of storm lengths and area sizes, from two days long to five days long, and standard areas from 1,000 square miles to 50,000 square miles. According to the preliminary data, Harvey was the worst in all but one.”
Nielsen-Gammon said that the most amazing record is for the five-day total over an area of 10,000 square miles.
“For Harvey to average 34.72 inches over five days across that large an area is ridiculous,” Nielsen-Gammon says. “The previous all-time United States record, set in Texas back in 1899, was estimated at 21.39 inches. Harvey exceeded that record by 62 percent.”
Ten other records were shattered by 20 percent or more, he confirms.
“To examine a storm’s flooding potential, scientists and engineers look at total rainfall over a large area over an extended period of time,” Nielsen-Gammon notes. “Extreme rainfall in one location causes problems, but when that rain falls over a much broader area, you get a disaster.”
To analyze Harvey, Nielsen-Gammon and Texas A&M colleague Brent McRoberts used the daily analyses produced by the West Gulf River Forecast Center in Fort Worth. Those detailed analyses are based on a combination of radar and rain gauge data, and are designed to help the National Weather Service with flood monitoring and prediction.
For historical context, Nielsen-Gammon compared Harvey’s totals to those of major United States storms of the past, as analyzed by Applied Weather Associates, a consulting firm based in Colorado that works extensively on extreme rainfall. He supplemented those analyses with reports prepared by the Army Corps of Engineers.
Nielsen-Gammon included all of the largest storms anywhere in the lower 48 states, as well as smaller storms east of the continental divide. He included storms as recent as last year and as distant as the 19th century.
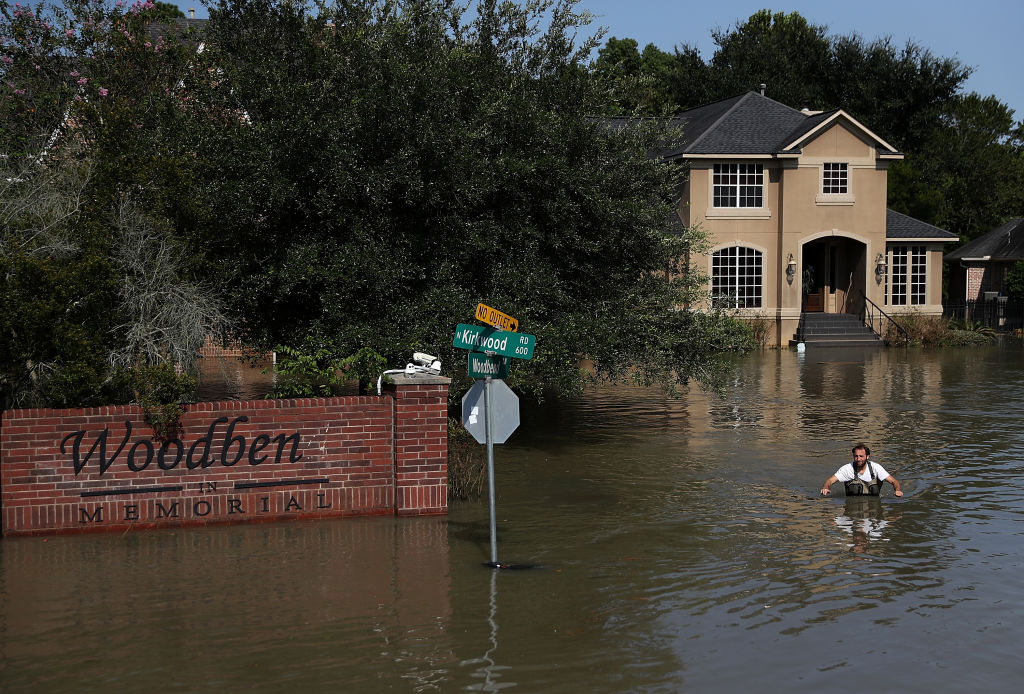
What Hurricane Harvey Says About Risk, Climate And Resilience
“These records are based on the areas that received the most rain,” Nielsen-Gammon said. “But I also wanted to see specifically what happened in Harris County, where Houston is located.”
To do this, Nielsen-Gammon compared rain gauge data provided by the Harris County Flood Control District with the River Forecast Center analyses.
“Based on both sets of data, Harris County averaged between 33.5 and 35.5 inches of rainfall over a five-day period. The previous all-time central and eastern United States record for the same size area was less than 30.5 inches,” he reports.
“The rain in Harris County was worse than the previous worst-case scenario. If Houston had gotten the equivalent of the worst storm in history, and if it had targeted Harris County like an expert marksman, it still would have fallen several inches shy of Harvey.”
Nielsen-Gammon says that these analyses are preliminary and conservative, and that Bill Kappel of Applied Weather Associates will be presenting a more complete analysis later this month at a conference in San Antonio. Others are also hard at work analyzing the storm.
Nielsen-Gammon also notes that information like this is essential for understanding the performance of existing flood control plans and infrastructure and for developing new ones.
“There has been lots of commentary about Houston development, disaster planning, and flood control measures in the wake of Harvey,” Nielsen-Gammon adds.
“But even the best urban preparations in the world would not have been designed for an event as extreme as Harvey.
“Now that we know what the atmosphere can do, we can prepare better for the next time,” Nielsen-Gammon added. “Except that because of climate change, we have to prepare for a moving target.”
Selected historical rankings compiled by Texas A&M’s John Nielsen-Gammon:
- Total 5-day rainfall averaged over 1,000 square miles (records for central and eastern United States)
- 45.71″ Harvey 2017
- 32.64″ Louisiana 1940
- 31.91″ Texas 1899
- 27.78″ Claudette 1979
- 27.20″ Beulah 1967
- Total 5-day rainfall averaged over 10,000 square miles (records for entire United States)
- 34.72″ Harvey 2017
- 21.39″ Texas 1899
- 20.50″ Beulah 1967
- 18.37″ Louisiana 1940
- 18.06″ Texas 1994
- Total 5-day rainfall averaged over 50,000 square miles (records for entire United States)
- 19.05″ Harvey 2017
- 16.00″ Beulah 1967
- 12.17″ North Carolina 2010
- 11.20″ Georges 1998
- 11.09″ Alex 2010
###
Media contact: John Nielsen-Gammon at (979 862-2268 or n-g@tamu.edu or Keith Randall, News & Information Services, at (979) 845-4644 or keith-randall@tamu.edu